just how big is it?Since the 1960’s the size of the garbage patch has significantly increased due to the increased use of plastic. It was estimated that each decade the patch doubles in size and in 2006, it was roughly twice the size of Texas. New studies have shown that in recent years, the gyre has grown in size and become roughly half the size of the continental United States.
This statistical infographic, about the size and problem of the Great Pacific Garbage Patch, was based on research collected by the United Nations Environmental Program. It shows that the average size of the Garbage Patch is approximately three times more than both Spain and Portugal combined, taking up more than 1 760 000 square kilometres of the ocean. What is alarming and frightening is the sheer volume of plastic waste found in our oceans. “There are between 13,000 and 18,000 pieces of plastic floating in every square kilometre of the oceans.” (UNEP 2005, 2006) “If you were to put a net in the water in one of these gyre centres, you would pull up more plastic than ocean life.” (Sebille, E, 2013) Charles Moore also stated that “In the central North Pacific Gyre, pieces of plastic outweigh the surface zooplankton by a factor of 6 to 1.” (Moore, C in Kostigen, T, 2008) 20% of the waste at sea is thrown off ships and oil platforms while the other 80% is land based.
This infographic created by the Ocean Conservancy in April 2013, shows many of the commonly found pieces of garbage that were collected in a coastal cleanup. Approximately 2 million cigarette butts were retrieved compared to 300 000 paper bags. There were also 1 million plastic beverage bottles collected during the cleanup. The majority of the items found are generally household items and deposited by consumers rather than industries. Overall, the number of items is irrelevant as they are all a different shape, size and weight. In 2001 an average American used approximately 223 pounds (100 kg) of plastic. By 2010 this was expected to increase by 103 pounds per person. Out of the 200 billion pounds of plastic the world produces each year, about 10% ends up in the ocean. “In 1999 there was 0.002 grams of plastic per square meter of ocean in the Eastern Garbage Patch, and as of 2005 there was 0.004 grams per square meter in the same place. In that same period plastic production in North America alone experienced double digit growth, topping 113 billions pounds in 2006, according to the plastics division of the American Chemistry Council in Arlington, Virginia.” (Eriksen, M, 2008 in Kostigen, T, 2008) It has been estimated that over 100 million tons of rubbish has been deposited into the garbage patch over the past 50 years. |
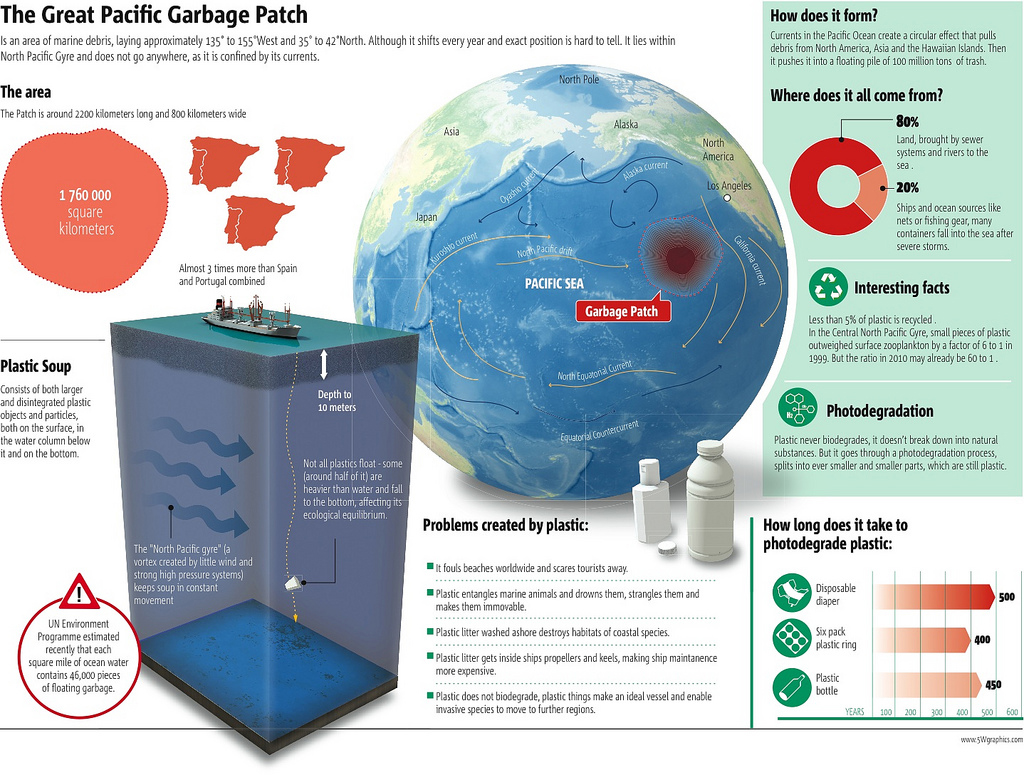
Location and Size of the Great Pacific Garbage Patch 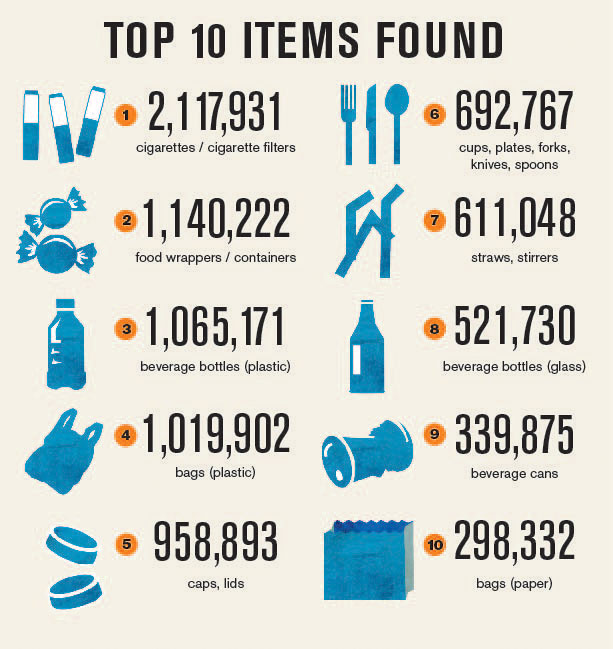
Top Ten Items found in a Coastal Cleanup Source:http://assets.cocacolacompany.com/25/d9/30a2a6ef4bba8c1a3c057fc40f43/ top-10-things-found-infographic.jpg 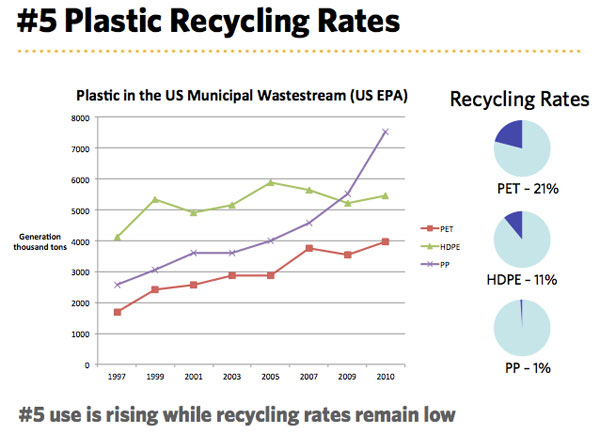
Plastic Recycling Rates from 1997 - 2010 including the amount of plastic produced each year. Source:http://www.thecloroxcompany.com/corporate-responsibility/blog/wp-content/uploads/2013/04/5-plastic-recycling-rates.jpg |
This graph created in 2013 shows the recycling rates of three different types of plastic in the United States. Over 13 years, both PP and PET plastics have increased in the production rate where HDPE has decreased. The recycling rates of all three plastics are very low with only 1% of PP plastic being recycled. This graph shows us the main concern for our modern society is that although we are increasing in production and efficiency, most of our rubbish is being thrown away and therefore ending up in patches like the Great Pacific Garbage Patch rather than being recycled and reused.
